In this article I am going to create a light-weigh dasboard build on ElasticSearch and Kibana which can monitor and analyse SOA Suite data. It is fast and easy to create. It is also extendible if you would like to do more analysis (Apache Spark), transform data before storing it (Logstash) or get data from other sources (Beats) and so on.

In this example I will setup a SOA Suite 12C with a custom policy which gathers all the data and pushes it into ElasticSearch. As ElasticSearch is very nicely integrated with Kibana as a visualization tool, we will then create a Kibana dashboard on top of the data which we are logging. Let’s get started.
Setup
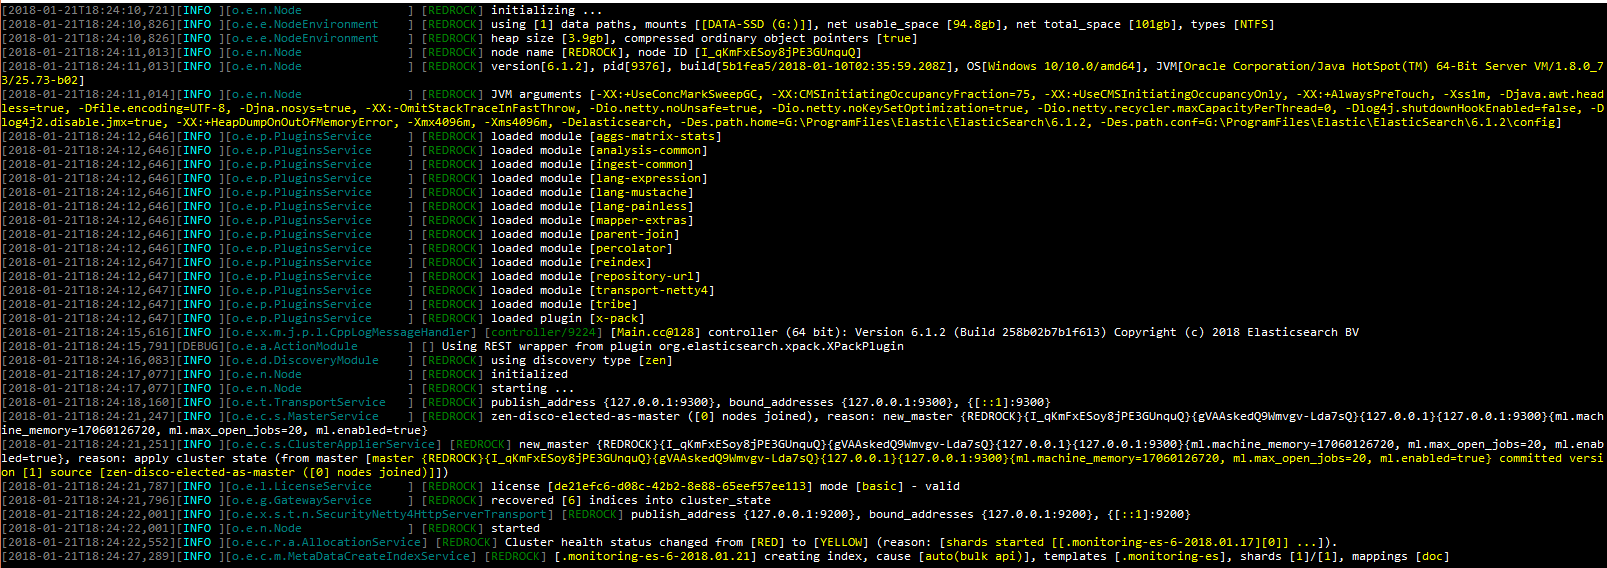
First of all we need a SOA Suite 12C instance. You can either use a docker image or install it….which ever you prefer. Next to that we need ElasticSearch and Kibana. I am using ElasticSearch 6.1.2 together with Kibana 6.1.1. You can download ElasticSearch here and Kibana here. You can start them both using executables in the bin folder. Once you started them you can check if they both are up and running. First run ElasticSearch
You can check if it is successfully up and running by making a GET Postman call to
http://localhost:9200/?pretty
This should result in something like this:
{
    "name": "REDROCK",
    "cluster_name": "elasticsearch",
    "cluster_uuid": "Bd5tesgAQf2xC7PwkZxXgw",
    "version": {
        "number": "6.1.2",
        "build_hash": "5b1fea5",
        "build_date": "2018-01-10T02:35:59.208Z",
        "build_snapshot": false,
        "lucene_version": "7.1.0",
        "minimum_wire_compatibility_version": "5.6.0",
        "minimum_index_compatibility_version": "5.0.0"
    },
    "tagline": "You Know, for Search"
}
Next lets start up Kibana:
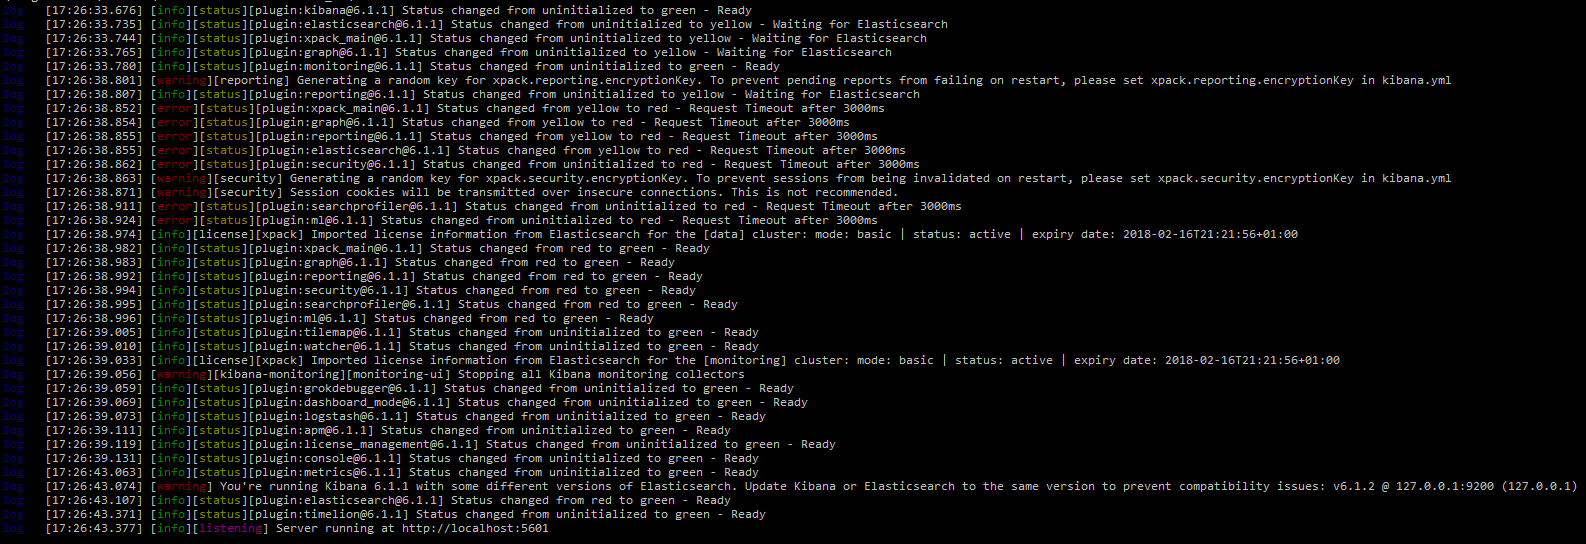
Check
http://localhost:5601
in your browser and you should get your Kibana app.
Custom policy for sending data to ElasticSearch
Next is how are we going to gather all the info we want to log and get it into ElasticSearch? One of the ways is to make a custom policy and let this one put the data into ElasticSearch. Is this example we will do that. In a real production environment I would go for a more solid approach and have the custom policy put a message on a queue to decouple. A very high performance solution would be a Kafka server for transport but would also add to the complexity. There are a number of solutions here, take a good look at the requirements and choose your best fit.
Lucas Jellema wrote and excelent article about creating a custom policy here. I am going to re-use the code to create my own policy which sends the data to ElasticSearch.
As I said before, I will not be using a queue but I will just make a HTTP PUT right into ElasticSearch. You can find my code here if you want to have a look at it. I added the zip to the server and added the custom policy to the domain.
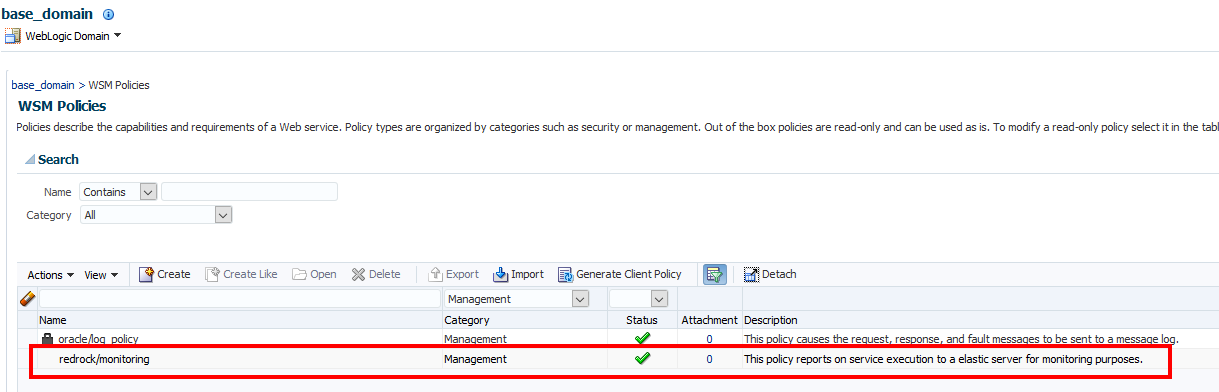
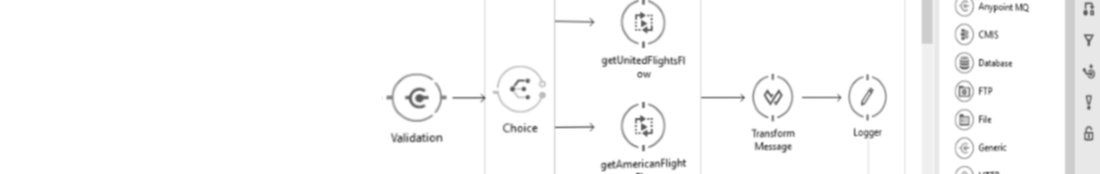
Then I configured the policy for an example OSB service I have running on my domain.
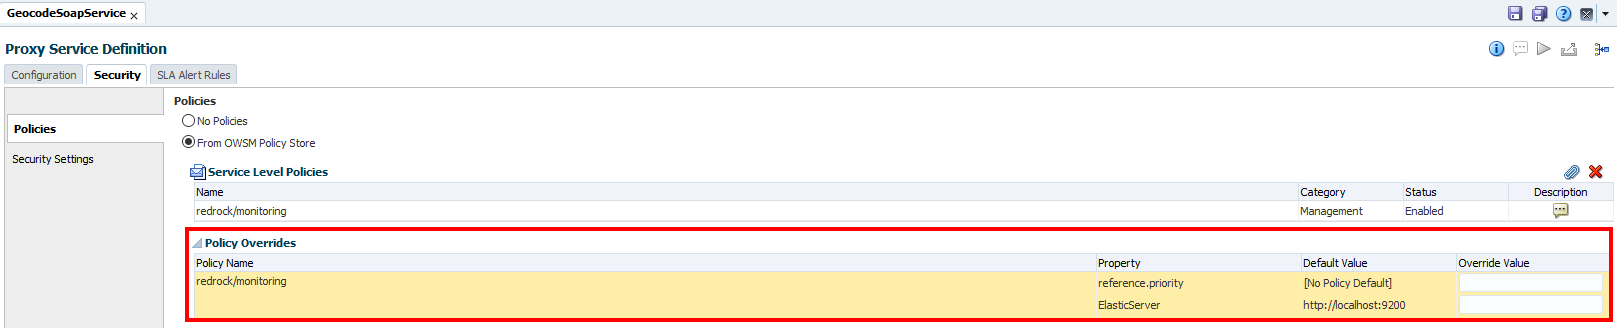
After saving and applying it all I fire of a simple soap request of my example service.
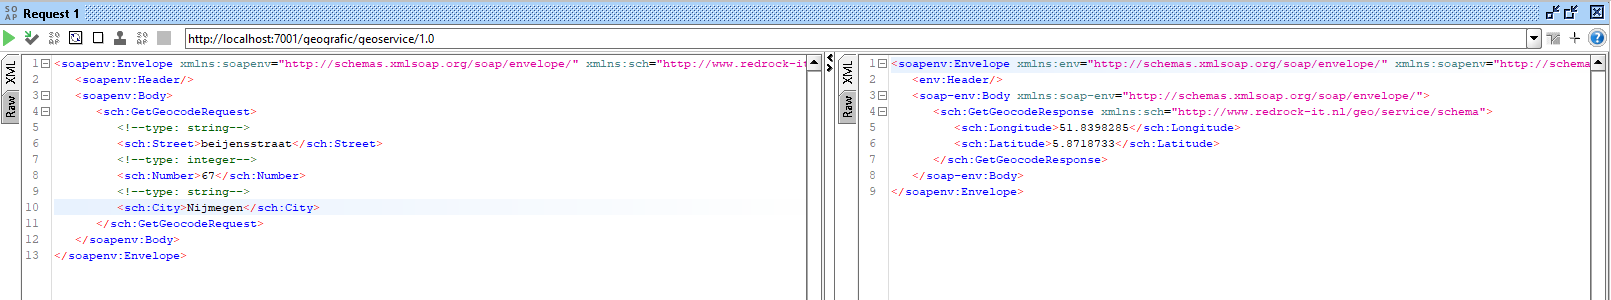
This comes back successful. Now have a look at the logging part in Weblogic:
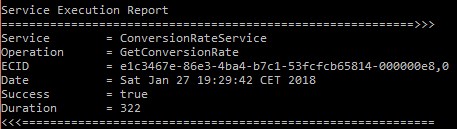
As you can see I extract the service name, the ECID, the date, whether it was successful or not and the response time. This I then put to the ElasticSearch server on the index /logs. To get some data in there I ran a load test in SoapUI.
Create a Kibana dashboard
Now go to the Kibana app by browsing to http://localhost:5601. The first thing you have to do is make an Index Pattern. Go to Management and then to Index Patterns. Now enter here the index to which you put the document so mine would be under logs*.
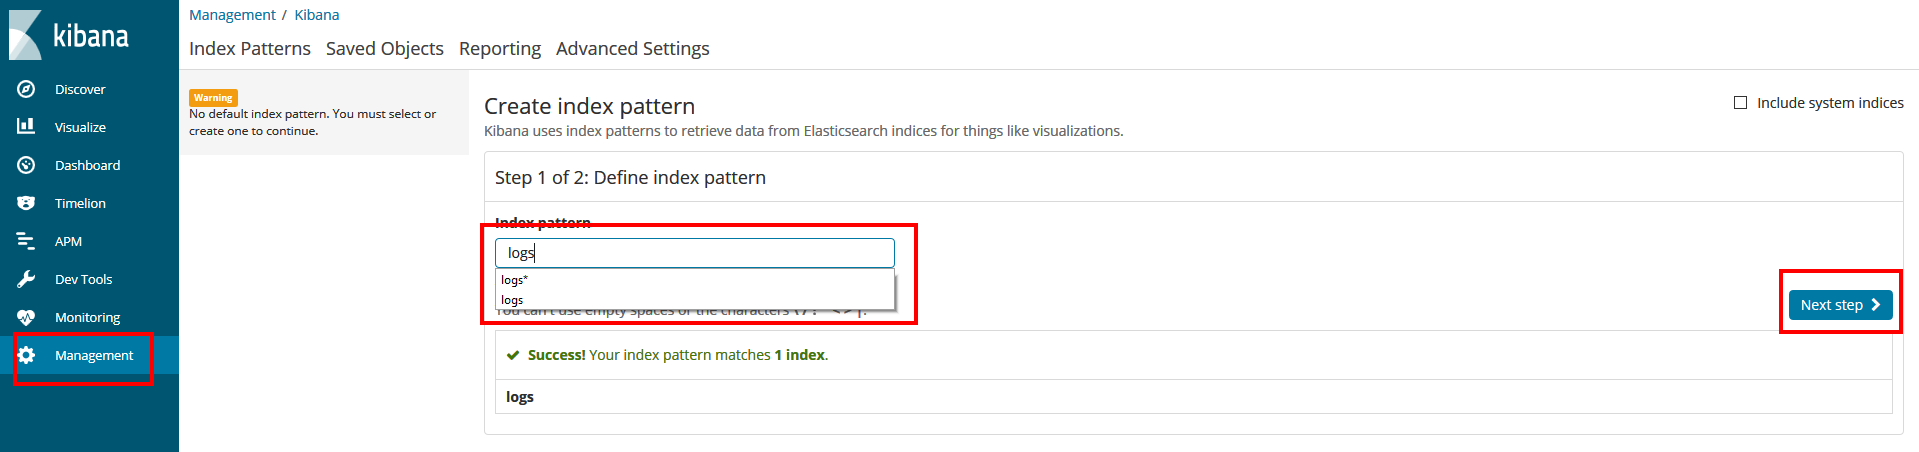
Click Next Step. Now we can also select a Time Filter field name as we send dates in. I choose not to use it and click Create Index Pattern. Now you will get an overview of the pattern. To see the data click on Discover.
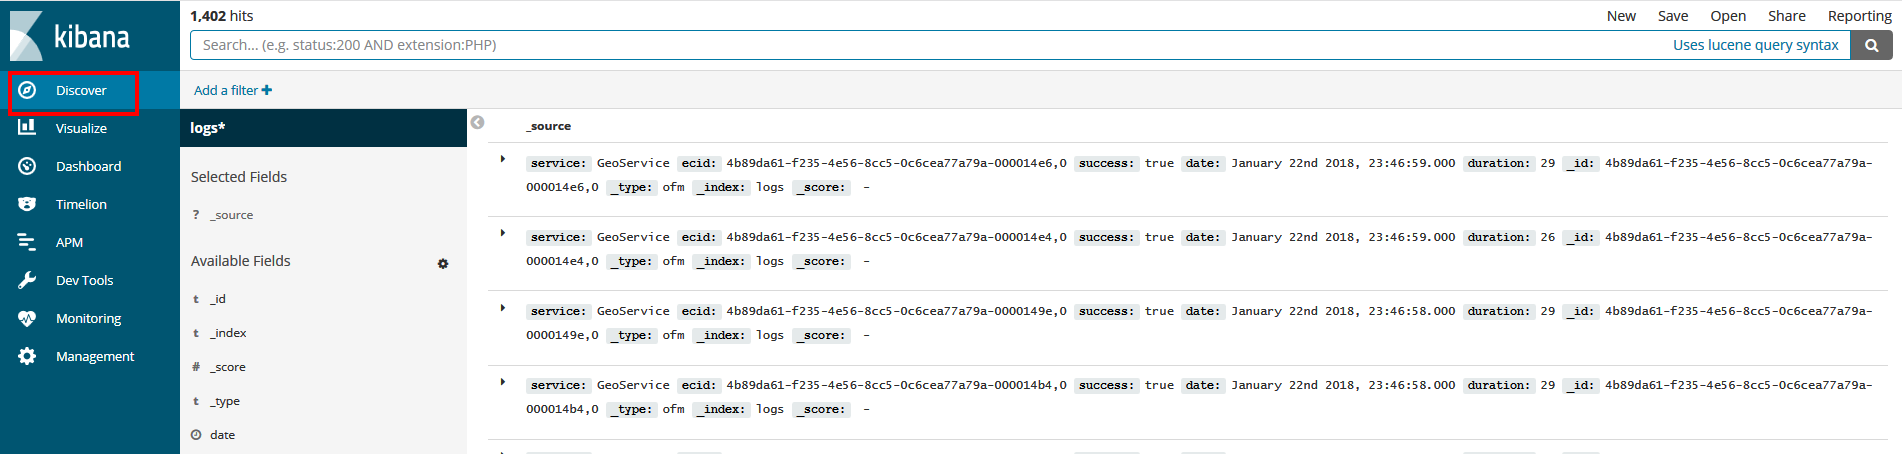
Here you can see all your data which you have put in and can query and filter if you want using the Lucene query syntax.
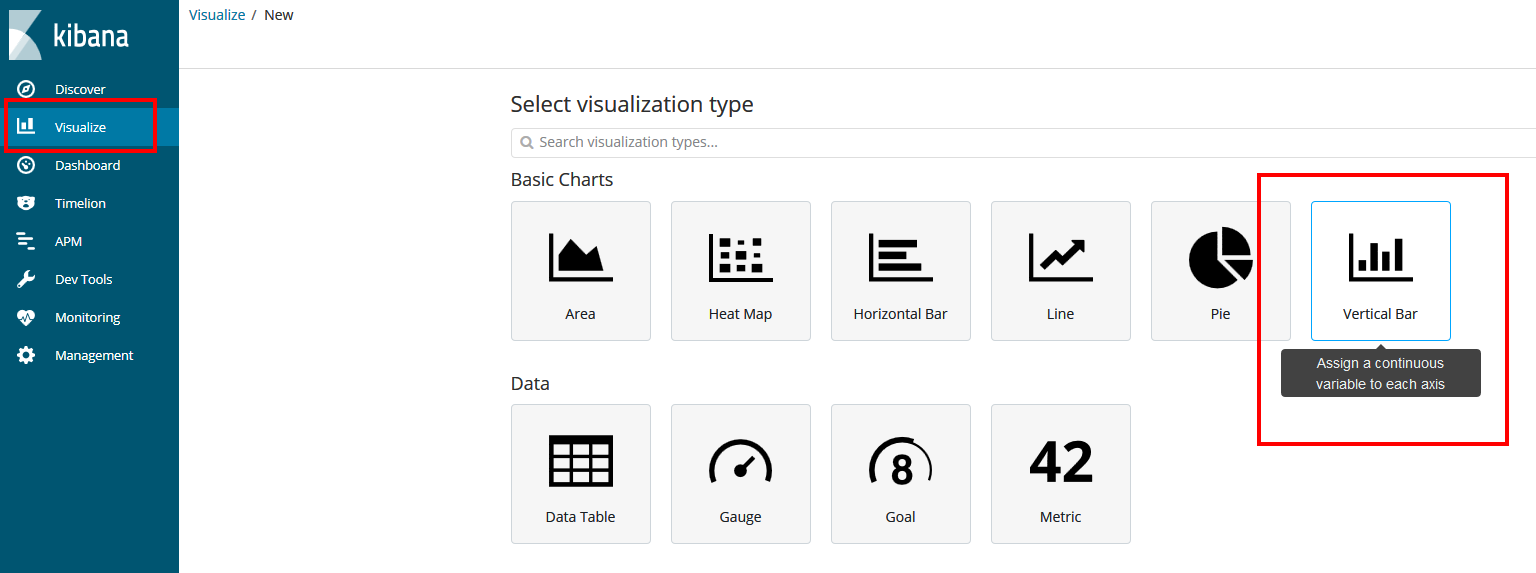
Now for getting the data into a dashboard. Click Visualize and the Create a visualization. I choose a Vertical Bar.
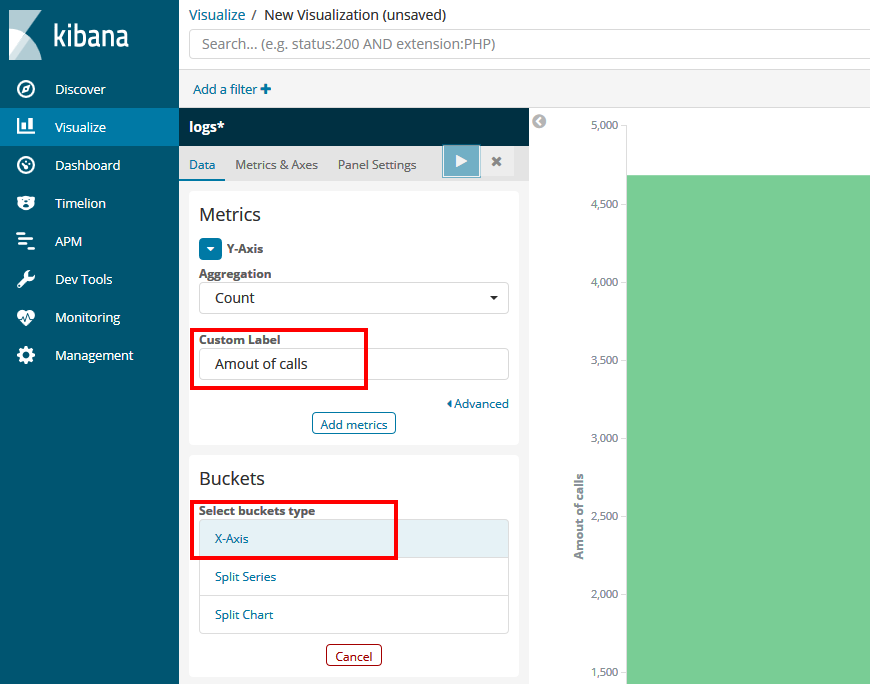
In the next screen you can choose an index or a Saved Search. I choose my previous created Logs* index. In the next screen you can configure how the graph should work and look like. I would like to see the amount of calls grouped by second for example. First I set the Custom Label of the vertical bar. Next I choose X-Axis as Buckets.
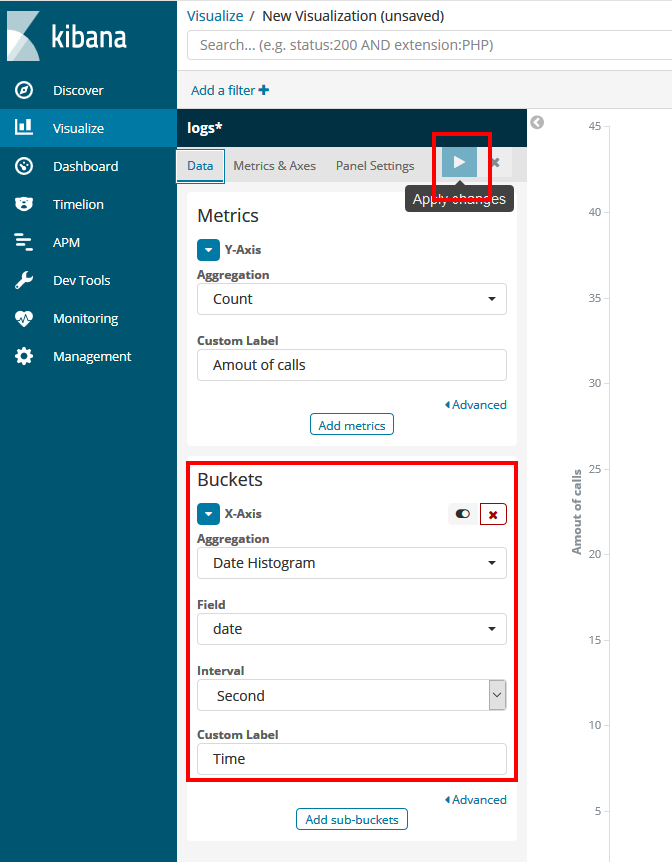
Next I select a Date Histogram as Aggregation. For Field I select my date field. For Interval I choose seconds and last I set my custom label to Time. Then you can press the Preview button for a preview on the right. If it looks good you can save it top right and give it a name. Now you can use it on a dashboard.
Click on Dasboard and choose Add. Now choose the visualization we just made…in my case Calls per second and voila. It shows the graph we have just configured. You can also configure it has to refresh every x seconds top right so you can actually see the calls near realtime. I also added a simple pie graph based on the amount of calls for each service.
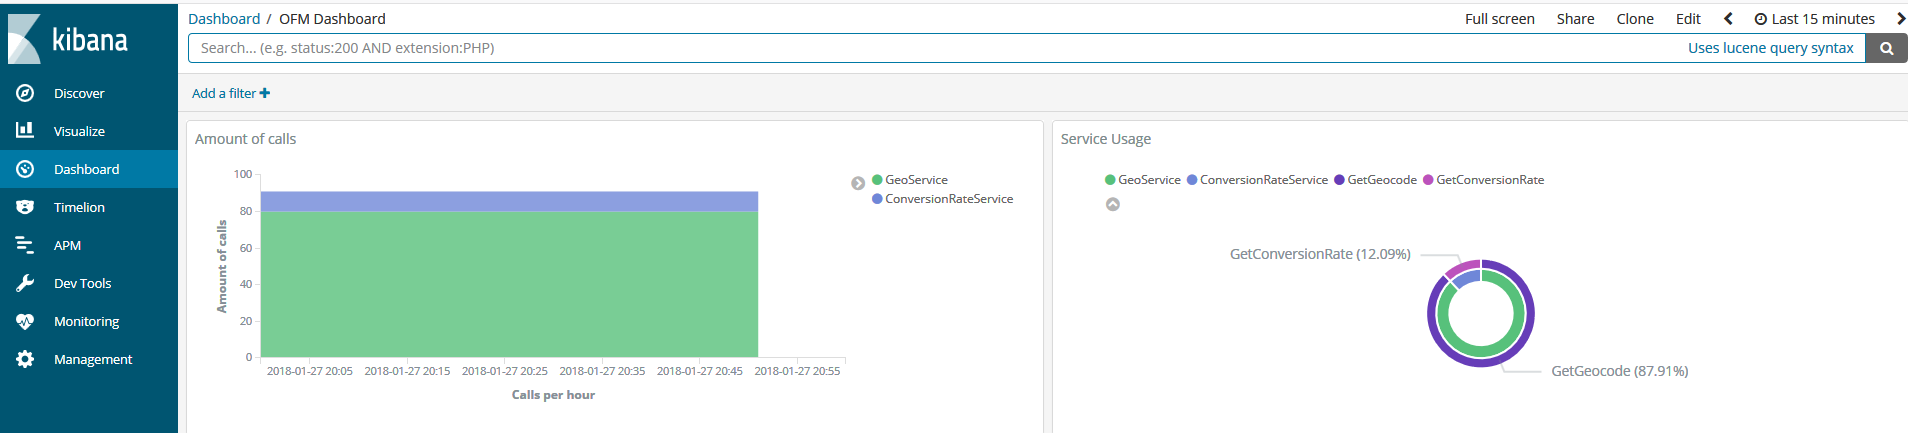
Also a cool feature is that when you select data in a graph, it will act as a filter and affects then all graphs on the dasboard. This way you can drill down into data visually.
Conclusion
I have just scratched the surface here of the power of ElasticSearch and Kibana. I am not a BigData/Business Intelligence guy but I found it quite intuitive to build visualizations. As the elastic stack is offered by several cloud vendors…..AWS, Azure and Elastic itself, it is easy to start. Decide which data would be interesting, make a loosely coupled sidestep for your data, stream it into ElasticSearch and visualize fast.
References:
Pingback: Setup a watcher in Kibana to send email notifications - REDROCK
Could you please send the jar file that you have created for sending report to elastic server
I tried 2 ways to send the data to the Elastic server. 1 just a direct call from the policy using Java.
public static void sendMessage(String aUrl, String aJson) throws Exception{
        URL url = new URL(aUrl);
        HttpURLConnection httpCon = (HttpURLConnection) url.openConnection();
        httpCon.setDoOutput(true);
        httpCon.setRequestProperty("accept", "application/json");
        httpCon.setRequestMethod("PUT");
        httpCon.setRequestProperty("Content-Type", "application/json");
        httpCon.setRequestProperty("Accept", "application/json");
        OutputStreamWriter out = new OutputStreamWriter(httpCon.getOutputStream());

        logger.info("Calling " + aUrl + " with HTTP PUT operation and message " + aJson);
        out.write(aJson);
        out.close();
        logger.info("Response" + httpCon.getResponseCode() + httpCon.getResponseMessage());
    }
but this has the downside that you might slow your api call down as this also takes time. My preferred method is to put the message on queue and create a simple OSB service which reads the queue and sends it to the Elastic server.
Hi,
Could you please send me the java class that you have created for “Monitoring and analysing SOA Suite data using Elastic search and Kibana”.
It would be a great help if you can send that code that you have created
To see how the custom policy works, you can check Lucas blog. The link is in this article. I can share the code I have created to build up my log message.
@Override
    public IResult execute(IContext iContext) throws WSMException {

        IResult result = new Result();

        try {
            //Check which stage I am in
            IMessageContext msgCtx = (IMessageContext)iContext;
            IMessageContext.STAGE stage = msgCtx.getStage();
            SOAPBindingMessageContext smc = ((SOAPBindingMessageContext) iContext);

            //REQUEST STAGE=====================================================
            if (stage == IMessageContext.STAGE.request) {

                LogEntry logEntry = new LogEntry();

                //set starting time
                msgCtx.setProperty("STARTTIME", Calendar.getInstance().getTimeInMillis());

                SOAPMessage requestSoapMessage = smc.getRequestMessage();

                //start to fill your logentry with data
                logEntry.setConversationId(getSoapHeaderValue(requestSoapMessage, CONVERSATIONID));
                ...
                ...
                logEntry.setServer(getHostName());

                //save logentry in the context
                msgCtx.setProperty("LOGENTRY", logEntry);
            }
            //RESPONSE STAGE=====================================================
            if (stage == IMessageContext.STAGE.response) {

                //get logentry from the context
                LogEntry logEntry = (LogEntry)msgCtx.getProperty("LOGENTRY");

                //calculate duration
                long endTime = Calendar.getInstance().getTimeInMillis();
                logEntry.setDuur(endTime - (long)msgCtx.getProperty("STARTTIME"));

                //Create an xml message from the LogEntry and put in the queue
                JAXBContextFactory factory = JAXBContextFactory.getInstance();
                JAXBContext jaxbContext = factory.getJaxBContext(LogEntry.class);
                Marshaller jaxbMarshaller = jaxbContext.createMarshaller();
                jaxbMarshaller.setProperty(Marshaller.JAXB_FORMATTED_OUTPUT, true);
                jaxbMarshaller.setProperty(Marshaller.JAXB_ENCODING, "UTF-8");
                StringWriter sw = new StringWriter();
                jaxbMarshaller.marshal(logEntry, sw);
                JMSTransporter.getInstance().sendMessage(sw.toString());
            }
        } catch (Exception ex) {
            //Als er iets fout gaat, inslikken en gewoon verder lopen
            log.warning("Error tijdens maken van logEntry " + ex.getMessage());
            ex.printStackTrace(System.out);
        }
        finally{
            //clear old context settings
            msgCtx.setProperty("LOGENTRY", null);
            msgCtx.setProperty("STARTTIME", null);
        }
        //allways respond with ok
        result.setStatus(IResult.SUCCEEDED);
        return result;
    }
Take care with the JAXBContext as there is a known memory leak in there so create a factory to create it once or else you will find yourself with exploding heap. See https://javaintherealworld.blogspot.com/2013/10/jaxbcontext-memory-leak.html