In this blog I showed how you can hook up you SOA Suite stack to ElasticSearch and create dasboards to monitor and report. Another nice feature is that you can set a watcher to monitor the data for you and send emails or post something on Slack when the event occurs. For example I want to be notified by email when more then 25 errors occur in a minute. Lets see how this works.

Setup the watcher
Login to you Kibana cloud instance and go to Management. There click Watcher.
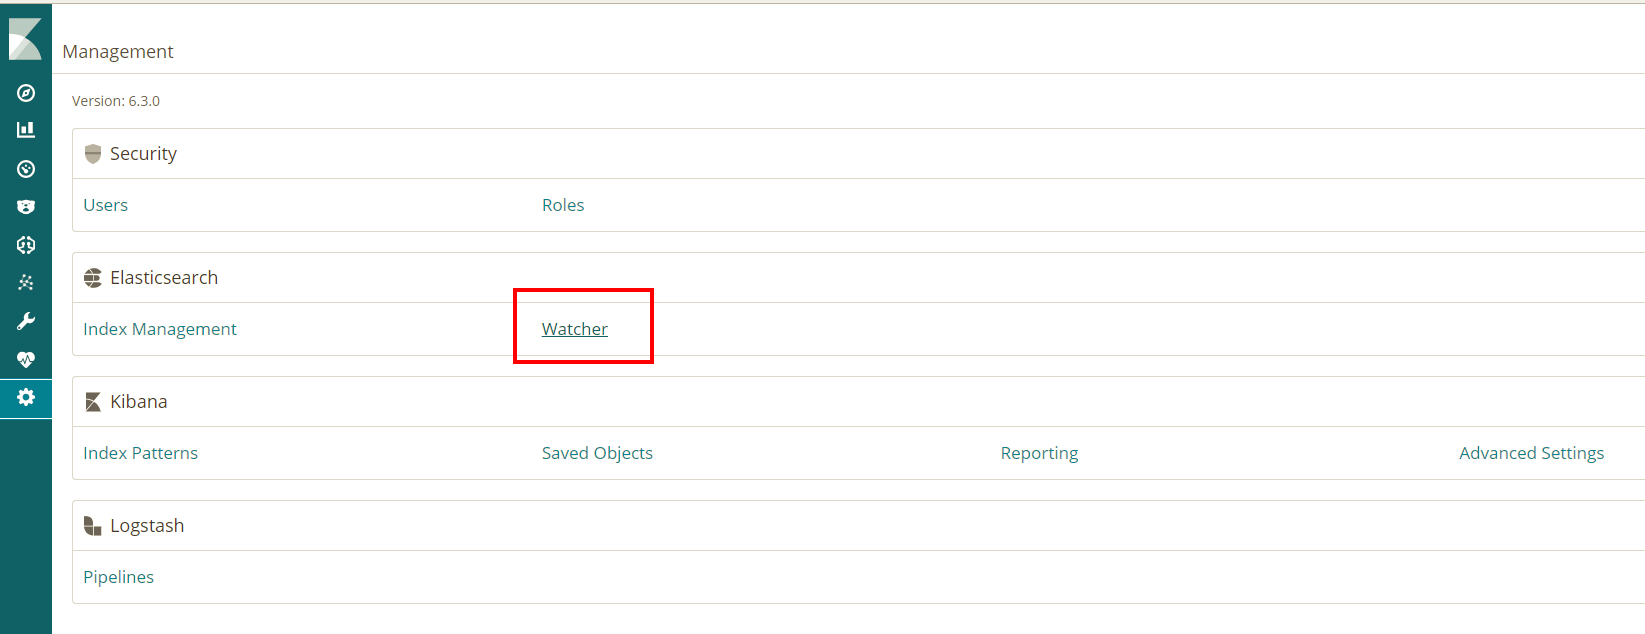
Here you see all the configured watchers. We want to create our own custom watch based on JSON click the dropdown and select Advanced Watch.
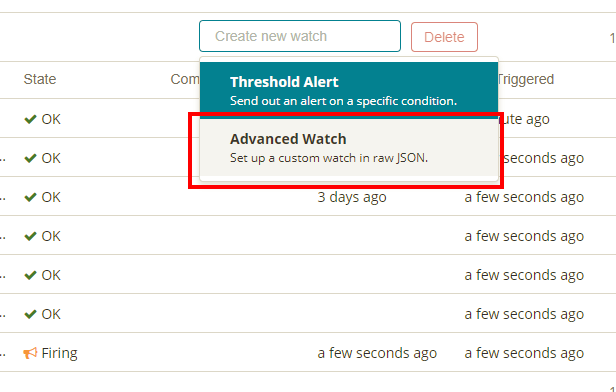
As you can see, you already get a preconfigured JSON which you can edit to your own liking. Our requirement are:
- Trigger every minute
- Triggers when more then 25 errors occured
- Send email
So lets translate this to the JSON. Dont forget to enter a Name and an ID for the watch.
First part, trigger every minute:
  "trigger": {
    "schedule": {
      "interval": "1m"
    }
  },
Second part, trigger when more then 25 errors occure within a minute. As you might have seen in my previous blog, we log the HTTP response code of every call so we want to check on this if it is a 500. So in the search, select the right index. In my case servicedata*. Next in the query, filter on time range from now-1minute. And as a last, match on httpResponseCode 500.
  "input": {
    "search": {
      "request": {
        "search_type": "query_then_fetch",
        "indices": [
          "servicedata*"
        ],
        "types": [],
        "body": {
          "size": 0,
          "query": {
            "bool": {
              "filter": [
                {
                  "range": {
                    "datum": {
                      "gte": "now-1m"
                    }
                  }
                },
                {
                  "match": {
                    "httpResponseCode": 500
                  }
                }
              ]
            }
          }
        }
      }
    }
  },
  "condition": {
    "compare": {
      "ctx.payload.hits.total": {
        "gte": 25
      }
    }
  },
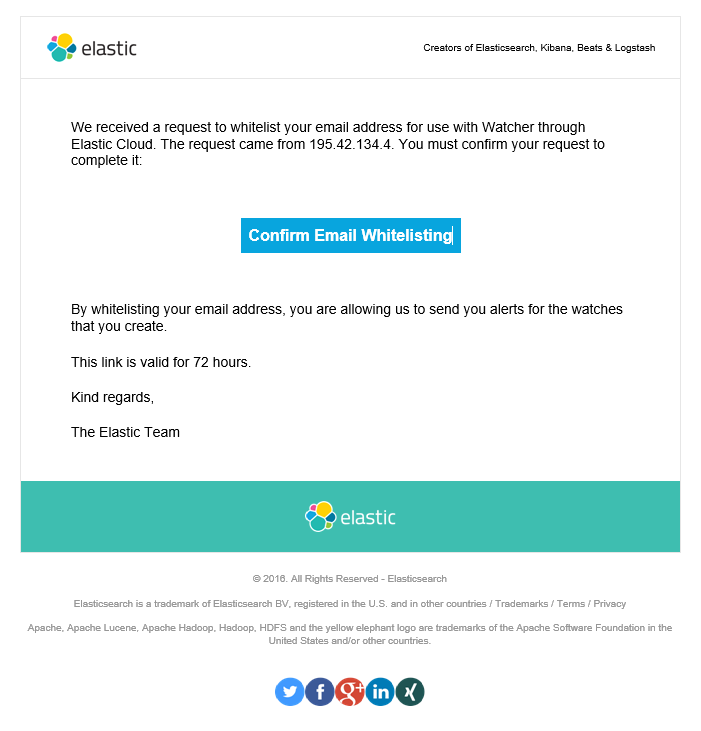
As the last part, send an email. Input the To value, the Subject and the Body. Be aware though that you have to white list the email address you want to send the email to. Go to https://cloud.elastic.co and log in. Then go to Profile and whitelist the email address.
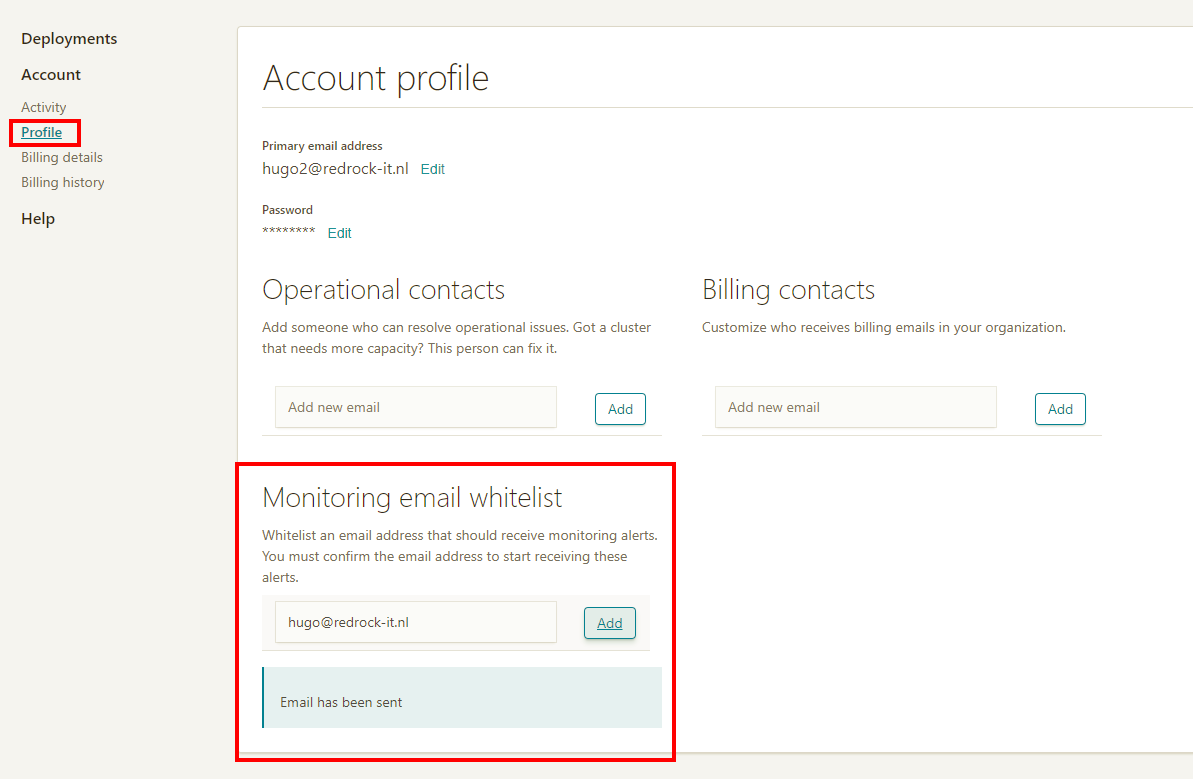 . An email for approval is send to the email address. Just open the email and Click Confirm Email Whitelisting.
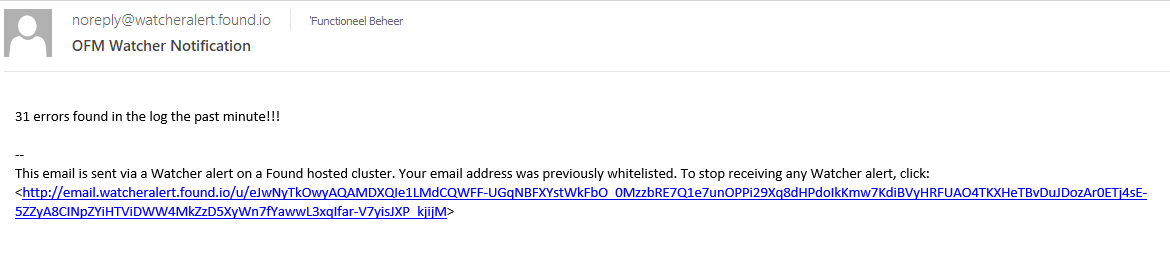
So now that we are whitelisted, we should be able to receive email. As the email text we just put a simple message in there.
"actions": {
    "send_email": {
      "email": {
        "profile": "standard",
        "to": [
          "'Functioneel Beheer '"
        ],
        "subject": "OFM Watcher Notification",
        "body": {
          "text": "{{ctx.payload.hits.total}} errors found in the log the past minute!!!"
        }
      }
    }
  }
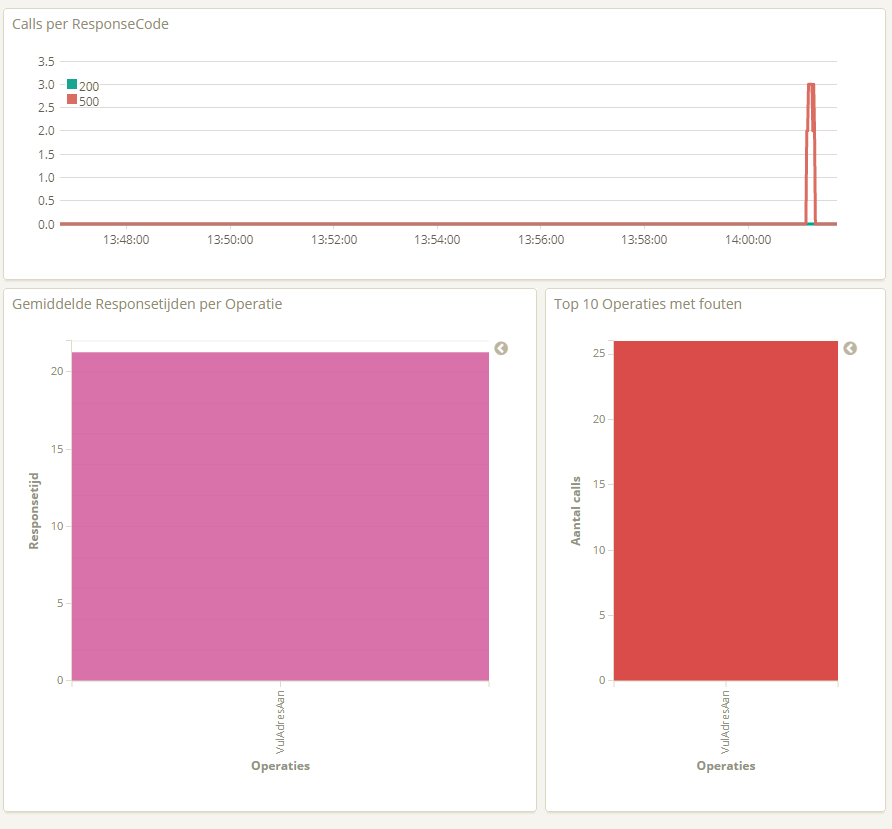
Ok now lets try it out. I will just call a service 26 times which shoudl create an error and lets see what it does. My Dashboard sees the errors.
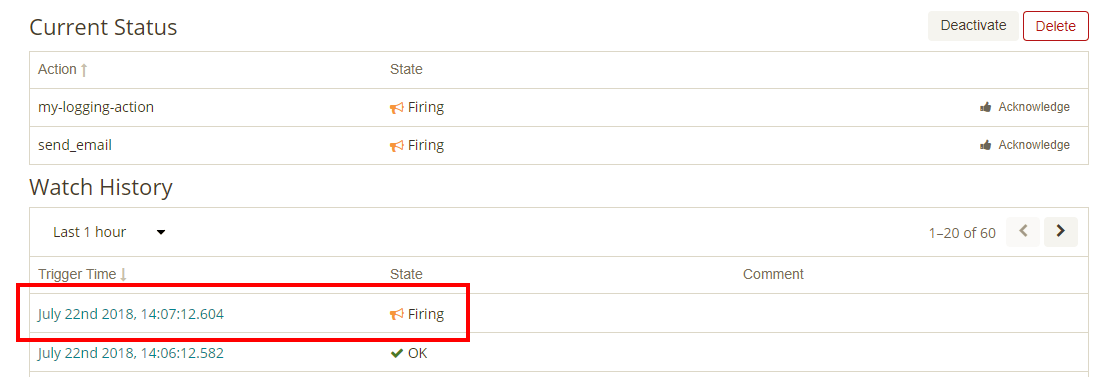
And when we look at the watch, we can see it fired.
And we got an email.
As you can see it is quite simple to create notification based on certain search criteria. Great to keep an eye out for certain occurrences.
References: